Chapter 16 Introduction to GIS
library(tmap)
library(mapview)
library(sf)
library(aqm)
data(vectors)
16.1 Concepts: What is a GIS?
The initials GIS stand for Geographical Information System. For many years a handful of companies produced and marketed GIS software. Many GIS courses were designed around these products. This led to the term being closely associated with desktop GIS such as Esri’s Arc GIS. The rise in use of this particular software occurred prior to the internet. Today, Geographical Information is an integral part of the internet. It is collected by us all every time we use a phone or computer (IP addresses are geo referenced). Almost all environmental data also has some form of spatial component. So, a modern Geographical Information System (GIS) must link to the internet and it must take in data from many different sources. There are a wide range of different tools for achieving this. Modern spatial data processing links these tools together. So an open source GIS is not a single piece of software, it is best thought of of an interlinked stack of software tools that are all working together. Some of the elements are visible to users and so controllable through a Graphical User Interface (GUI). Other elements work behind the scenes to provide the data streams and spatial algorithms. Many of the more traditional skills taught on GIS courses that used single pieces of software are still relevant, but they now link into this broader based concept of spatial data analysis. We can consider Google Maps, SatNavs, sports tracking phone apps, weather maps etc as all examples of modern GIS’s. The statistical software R is also a GIS. We all use GIS’s every day, often without realising it.
16.2 Desktop GIS software
Desktop software with a GUI remain important analytical and cartographic tools for all environmental scientists and managers. In 2018 there are two popular options. Esri’s ArcGIS still has the largest commercial market share. However many users have now switched to the free and Open Source QGIS. This provides most of the same basic functionality as ArcGIS and a similar look and feel. One advantage of QGIS is clearly the cost (it is free). QGIS also links very cleanly with a wide range of additional open source software for spatial data processing. If you learn to use QGIS it is easy that can implement the more advanced operations that are also available in ArcGIS. The interfaces are quite similar, although there are a few differences in layout. All spatial data sets can be saved in generic formats that can be opened in both pieces of software. GIS skills are not really software specific. If you learn to run an analysis in one piece of software you can easily learn to run it in another. The key element required to become comfortable working with GIS is a good understanding of the nature of spatial data sets and the range of operations that can be performed on them.
16.3 Analysing Geographical data using scripts
Given that analysing geographical information is such a visual task it may seem odd to find that GIS professionals mainly use scripts of some type to run analyses. However there are many advantages to using scripts. Once again the key feature of scripted analyses is reproducibility. A script is a set of instructions that will exactly reproduce the same result given the same input data, and will reproduce the same analysis in a different context if provided with a different set of input data. This allows routine GIS tasks to be run automatically when data changes or the focus of attention moves to a different area.
Follow the link for more detail. “What is geocomputation?” https://geocompr.robinlovelace.net/intro.html#what-is-geocomputation
16.4 Some key GIS concepts
Some core concepts are involved in all GIS.
16.4.1 Coordinate reference systems and projections.
Geographical information is of course spatially explicit, and it can be mapped onto the earth surface. This means that we work with coordinates.
The following are two common types of coordinate systems used in a geographic information system (GIS):
A global or spherical coordinate system such as latitude-longitude. These are often referred to as geographic coordinate systems.
Projected coordinate system such as universal transverse Mercator (UTM), the British National Grid, Albers Equal Area, Google mercator etc. There are a large number of other map projection models which all provide mechanisms to project maps of the earth’s spherical surface onto a two-dimensional Cartesian coordinate plane.
A GIS can transform (project) spatial data from one CRS to another more or less seamlessly.
16.4.2 Raster and vector data
There are two ways that geographical data can be represented. Most GIS projects include a mixture of them
Raster layers are made up of pixels or cells. A satellite image or an aerial photo are examples of rasters. In these cases the coloured visual representation is made of three bands, red, blue and green which are blended together to form an image. Another typical example of a raster layer is a digital elevation model. In this case the cell values correspond to height above sea level, or some other reference point. The pixel size defines the resolution of a raster layer. The smaller the pixel the finer the resolution and level of detail. See the next section on Lidar derived data for more details.
Vector layers consist of tables of data (attributes) together with descriptions of the geometries of the objects with these attributes. The geometries can be polygons, lines or points. There are also multi types for each of these. For example, the United Kingdom.
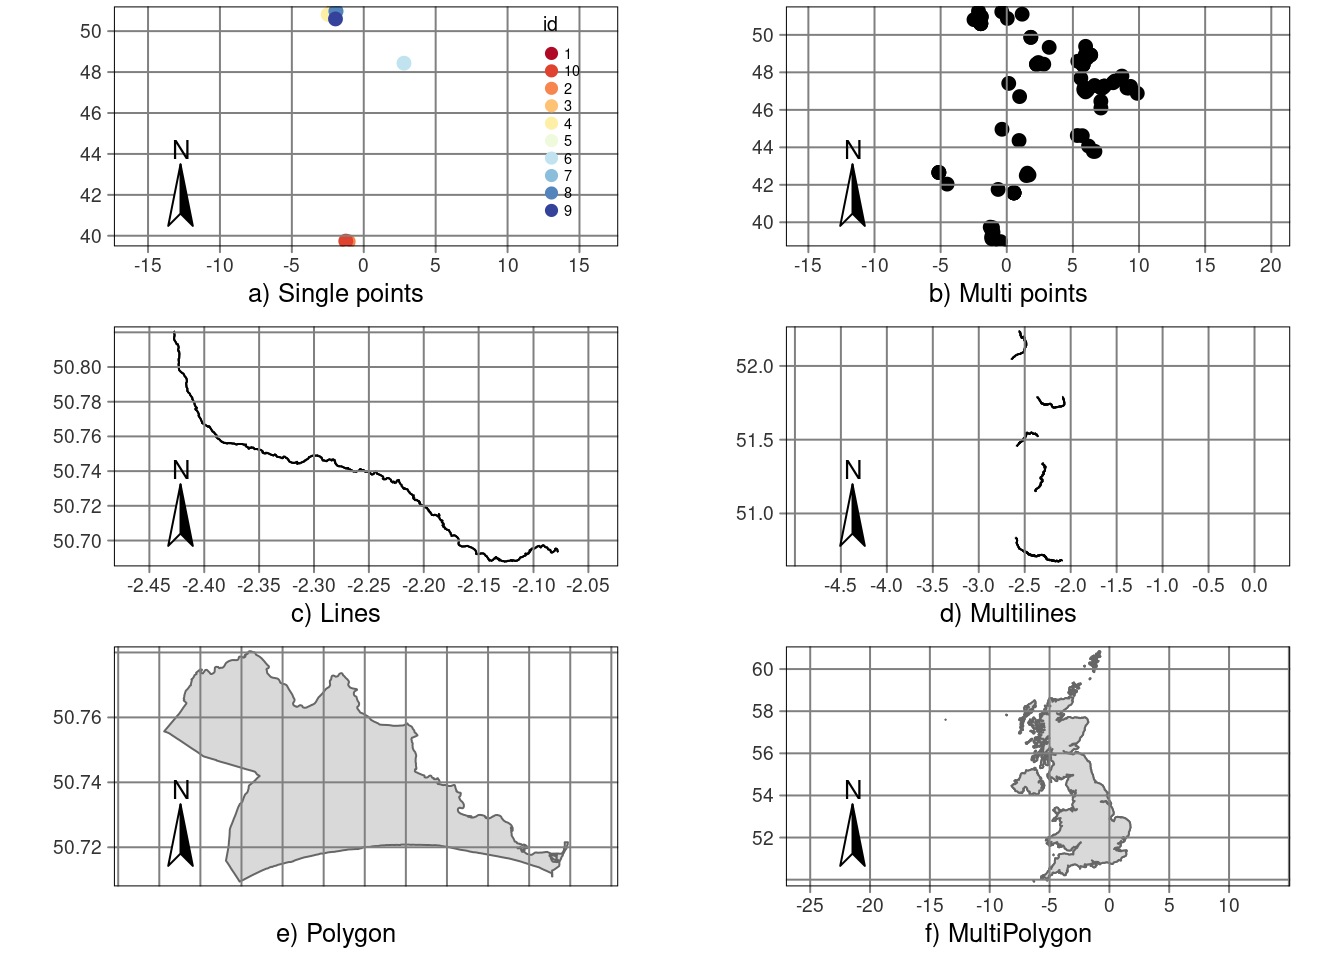
Figure 16.1: Examples of vector data: Points can be either single (record of one occurence of a species) or multiple (all occurrences of a species). Lines can be held as either single features with corresponding to a name, e.g. the river Piddle, or multiple sections of a single river. Polygons can be either single (Bournemouth) or multiplygons (UK)
16.5 Traditional cartography
R can be used to make traditional maps that can be printed. Cartographers insist on the inclusion of the following elements.
- Scale bar or grid.
- North arrow
Th tmap package in R is designed to produce maps with traditional cartographic properties. Using tmap for complex data sets can be rather time consuming, but default styles can change the look and feel of maps easily. Here are two examples using a simple multipolygon layer representing the outline of the United Kingdom.
t1<-tm_shape(uk) + tm_borders()
t2 <- t1  + tm_fill()  +tm_grid()
t3<-t2  + tm_compass(pos=c("left", "bottom"))
t4<- t3 + tmap_style("classic")
t4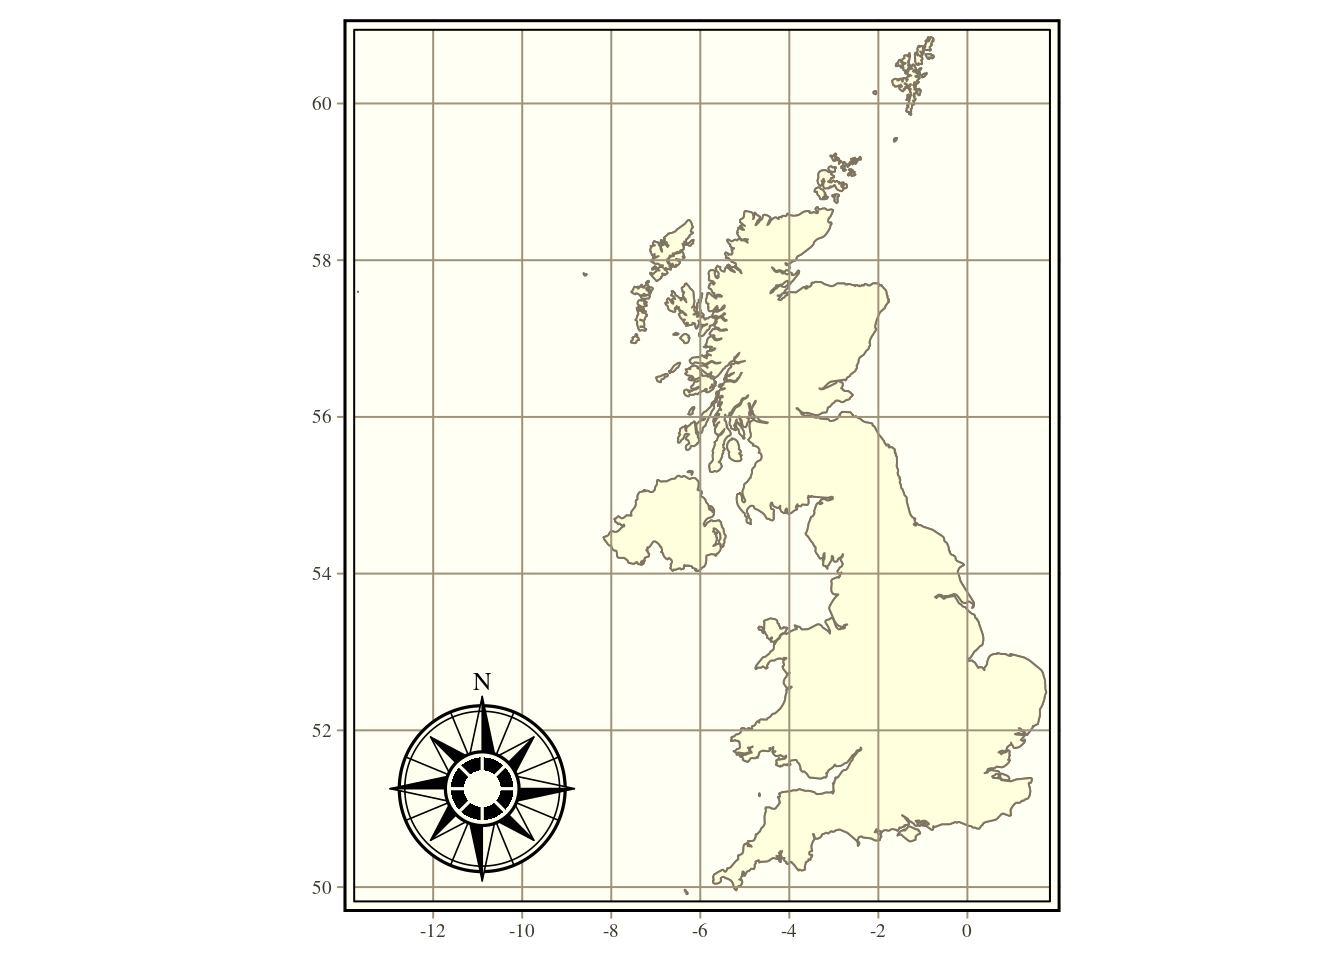
Figure 16.2: Map of the UK shown in a very traditional cartographic style
t5 <-t4 +  tmap_style("natural")

t5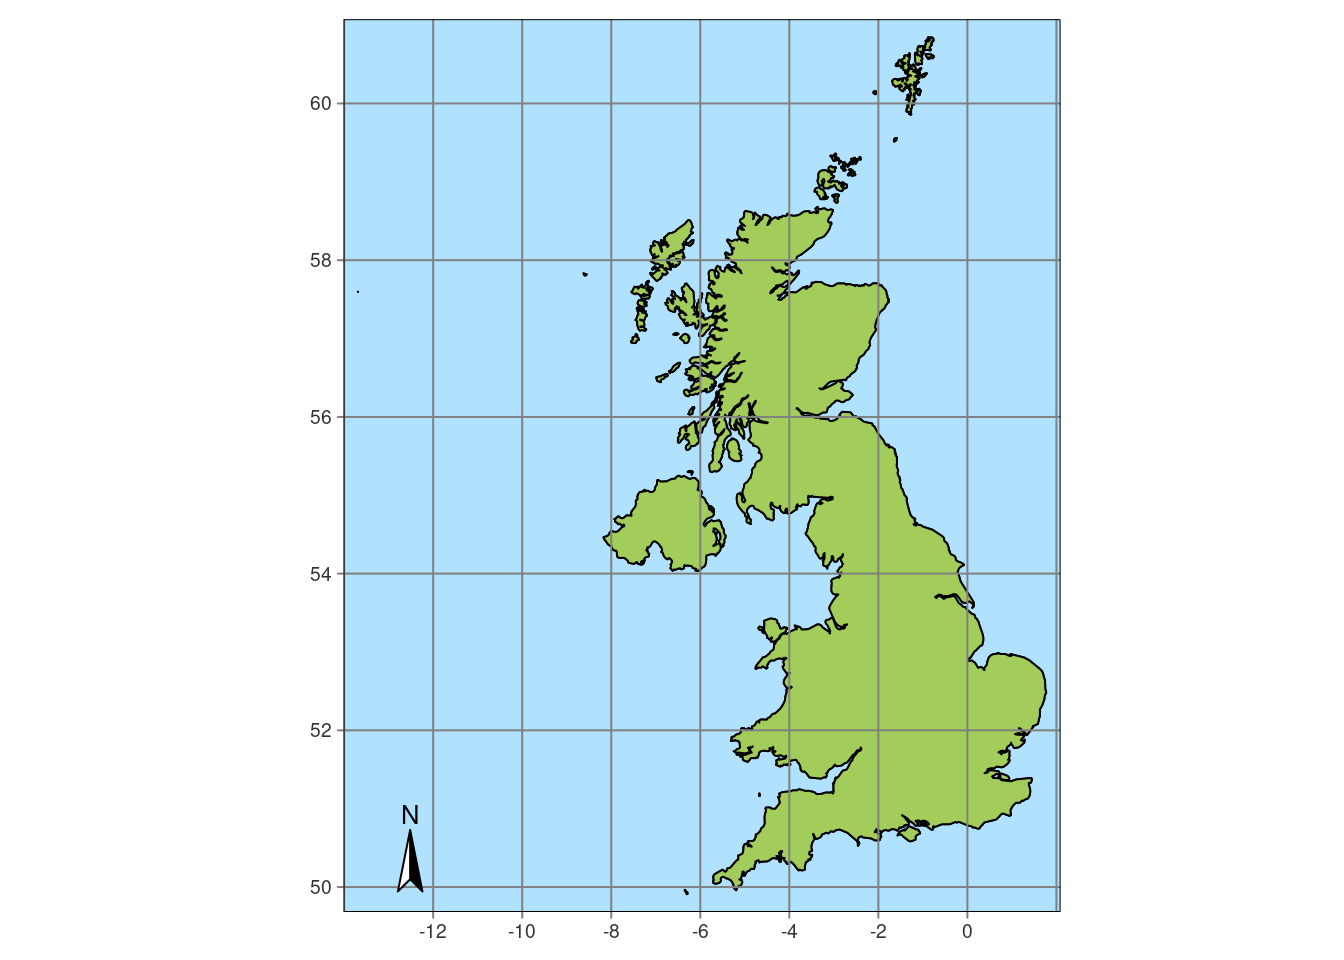
Figure 16.3: Map of the UK shown in a simple 1970s weather map type style
16.6 Web maps
Web maps are much more useful for analytical purposes than traditional maps. A webmap allows the user to combine data with a range of underlying basemaps. Web maps are “slippy” and “zoomable.”
The mapview package in R is the simplest way to make a web map. The vector data loaded from the aqm package contains a simple outline of the UK. This can be turned into a web map very easily.
mapview(uk)It’s often useful to change the base maps and add a full screen button.
 mapviewOptions(basemaps =c("Esri.WorldImagery",
                             "OpenStreetMap",
                             "Esri.WorldStreetMap",
                             "OpenTopoMap"))
m<-mapview(uk)
m@map %>% leaflet.extras::addFullscreenControl()