Maxent model


This page contains some analysis of the Maxent model result, created Wed May 29 09:53:15 UTC 2019 using 'dismo' version 1.1-4 & Maxent version 3.4.1. If you would like to do further analyses, the raw data used here is linked to at the end of this page.


Analysis of omission/commission

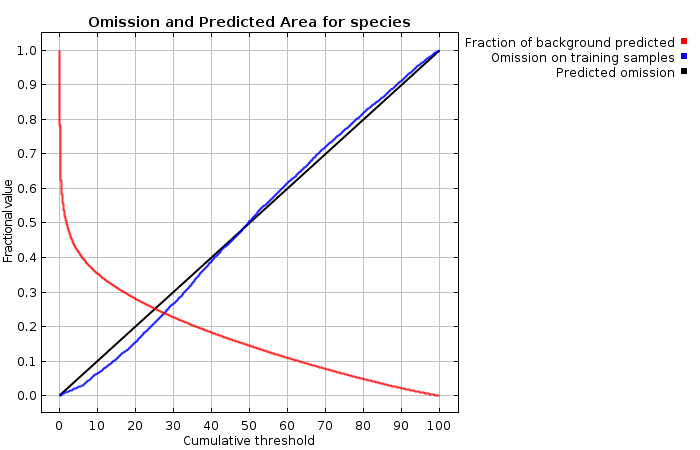
The following picture shows the omission rate and predicted area as a function of the cumulative threshold. The omission rate is is calculated both on the training presence records, and (if test data are used) on the test records. The omission rate should be close to the predicted omission, because of the definition of the cumulative threshold.


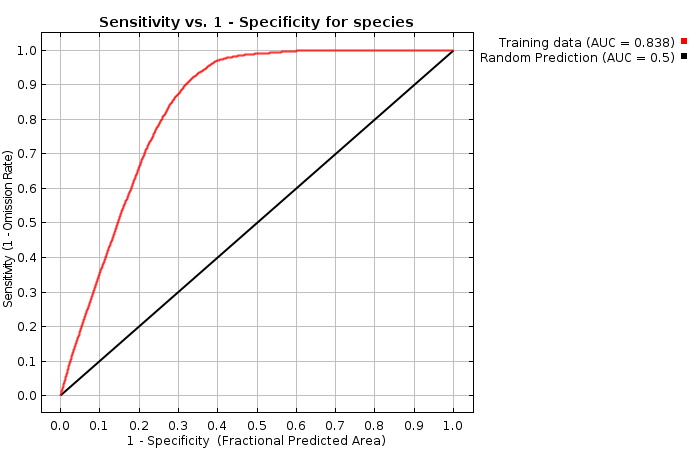
The next picture is the receiver operating characteristic (ROC) curve for the same data. Note that the specificity is defined using predicted area, rather than true commission (see the paper by Phillips, Anderson and Schapire cited on the help page for discussion of what this means). This implies that the maximum achievable AUC is less than 1. If test data is drawn from the Maxent distribution itself, then the maximum possible test AUC would be 0.830 rather than 1; in practice the test AUC may exceed this bound.


Some common thresholds and corresponding omission rates are as follows. If test data are available, binomial probabilities are calculated exactly if the number of test samples is at most 25, otherwise using a normal approximation to the binomial. These are 1-sided p-values for the null hypothesis that test points are predicted no better than by a random prediction with the same fractional predicted area. The "Balance" threshold minimizes 6 * training omission rate + .04 * cumulative threshold + 1.6 * fractional predicted area.

Cumulative thresholdCloglog thresholdDescriptionFractional predicted areaTraining omission rate
1.0000.061Fixed cumulative value 10.5410.007
5.0000.234Fixed cumulative value 50.4140.026
10.0000.371Fixed cumulative value 100.3530.065
0.0260.003Minimum training presence0.7470.000
14.1500.45310 percentile training presence0.3190.100
27.4340.581Equal training sensitivity and specificity0.2390.239
10.8180.386Maximum training sensitivity plus specificity0.3450.070
2.0560.107Balance training omission, predicted area and threshold value0.4870.011
3.6430.175Equate entropy of thresholded and original distributions0.4400.018


(A link to the Explain tool was not made for this model. The model uses product features, while the Explain tool can only be used for additive models.)


Analysis of variable contributions


The following table gives estimates of relative contributions of the environmental variables to the Maxent model. To determine the first estimate, in each iteration of the training algorithm, the increase in regularized gain is added to the contribution of the corresponding variable, or subtracted from it if the change to the absolute value of lambda is negative. For the second estimate, for each environmental variable in turn, the values of that variable on training presence and background data are randomly permuted. The model is reevaluated on the permuted data, and the resulting drop in training AUC is shown in the table, normalized to percentages. As with the variable jackknife, variable contributions should be interpreted with caution when the predictor variables are correlated.

VariablePercent contributionPermutation importance
bio742.321.2
bio1729.632.1
bio39.68.1
bio25.53.3
bio154.41.6
bio42.47.5
bio101.95.8
bio191.43.4
bio80.81.1
bio90.72.4
bio180.31.7
bio130.30.3
bio60.34
bio140.36.8
bio50.10.7
bio1200
bio1100
bio100
bio1600


Raw data outputs and control parameters


The data used in the above analysis is contained in the next links. Please see the Help button for more information on these.
The model applied to the training environmental layers
The coefficients of the model
The omission and predicted area for varying cumulative and raw thresholds
The prediction strength at the training and (optionally) test presence sites
Results for all species modeled in the same Maxent run, with summary statistics and (optionally) jackknife results


Regularized training gain is 0.822, training AUC is 0.838, unregularized training gain is 0.881.
Algorithm terminated after 500 iterations (7 seconds).

The follow settings were used during the run:
2758 presence records used for training.
12758 points used to determine the Maxent distribution (background points and presence points).
Environmental layers used (all continuous): bio1 bio10 bio11 bio12 bio13 bio14 bio15 bio16 bio17 bio18 bio19 bio2 bio3 bio4 bio5 bio6 bio7 bio8 bio9
Regularization values: linear/quadratic/product: 0.050, categorical: 0.250, threshold: 1.000, hinge: 0.500
Feature types used: hinge product linear quadratic
outputdirectory: maxent
samplesfile: maxent/presence
environmentallayers: maxent/absence
autorun: true
visible: false
Command line used: autorun -e maxent/absence -o maxent -s maxent/presence -z

Command line to repeat this species model: java density.MaxEnt nowarnings noprefixes -E "" -E species outputdirectory=maxent samplesfile=maxent/presence environmentallayers=maxent/absence autorun novisible